Locating Cave Sites: Results of our Remote-sensing Research
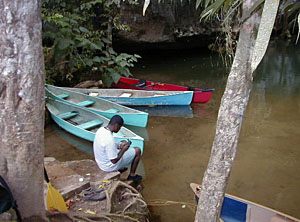
At the end of the summer in 2000, we visited 20 cave sites in our study area in west-central Belize (see field updates from August 31, 2000 and September 18, 2000). At each site we took GPS points, evaluated the composition of the jungle species, and recorded temperature information.
Click here for background on WBRCP's remote-sensing project.
Our first hypothesis was that if the plant life around cave entrances differed from the surrounding jungle, this might result in a signature in the jungle canopy over cave entrances that could be identifiable in the multispectral bands of LANDSAT satellite images.
With the help of locals familiar with the region's various trees and plants, we conducted a basic vegetation survey at each site, recording the different species at the cave entrances and surrounding areas. We were encouraged by the fact that many of the fruit trees that contribute to the diet of bats were present near the cave entrances. However, as we extended our survey beyond the cave entrances, we noticed that these species of fruit trees were present in relatively the same frequency in areas away from the caves. We did note one species that was present in and around many of the cave entrances--the diminutive pacaya palm. But because of its small size, we were skeptical about how much this plant would differentiate the jungle canopy above cave entrances from the surrounding area.
Our second hypothesis was that there would be temperature differences between cave entrances and the surrounding area, and that this would be detectable in the thermal band of LANDSAT satellite images.
So, at each site we also recorded temperature information. We had three digital thermal data loggers at our disposal. To evaluate the differences in temperature at each cave site, we placed one logger just outside the entrance to the cave and the other two 50 to 100 meters away.
The temperature data were encouraging, as there was a noticeable difference between the cave entrances and the control locations. For all of the cave sites the greatest temperature difference was 19.2 degrees, and the average difference was 7.2 degrees. We were hopeful that these differences would show up in the satellite image. If it worked, this would allow us to identify undiscovered caves with similar differences in the thermal band.
Following the fieldwork in Belize, we returned to the image-processing computer labs at Indiana University. We downloaded the GPS points for the cave sites and plotted them on the LANDSAT and RADAR images of the study area.
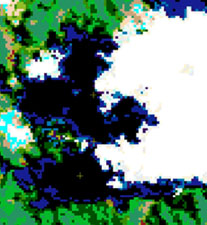
It was in this step that we encountered one of the most frustrating aspects of satellite-based remote sensing: cloud cover. Satellite multispectral scanners cannot see through clouds. Out of the 20 cave entrances we visited, 15 were underneath cloud cover or shadow in our LANDSAT 5 image, leaving us with only five cave locations with multispectral signatures free from interference.
Although this situation was somewhat disheartening, we went ahead with the analysis for the unshrouded cave sites. Using the image processing software, we tried to identify any possible differentiation between the caves and their surrounding areas.
In the thermal band our classification did not yield any differentiation between cave entrances and the surrounding areas. The resolution of the LANDSAT 5 thermal band was simply too coarse to pick up the temperature differences. Our classification of the multispectral bands for the areas surrounding the known cave entrances was surprising, because it showed us what we wanted to see, but not what we expected based on our survey in the field.
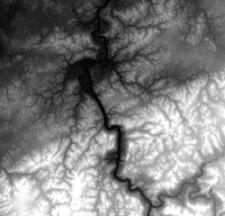
Our third hypothesis had been that cave entrances would have a specific topographic signature that would be identifiable in the digital elevation models generated from the Star 3i RADAR data. Our analysis of this data was the most encouraging and exciting aspect of our project. We generated a color ramp (range of colors) to accentuate elevations, and overlaid GPS points for the cave entrances on the RADAR image to see if a topographic signature would become apparent for cave entrances.
We found that most of the cave entrances, all of which ranged from 2 to 15 meters in width, did not show up in the radar image. However, one large sinkhole entrance for which we had a GPS point (Actun Yaxteel Ahau) was distinct. This entrance was the only sinkhole that was larger than 10 meters, or larger than one individual pixel of the Star3i RADAR image. In the field we recorded that the sinkhole was 25 meters in diameter and approximately 10 meters deep. When we generated a contour map from the digital elevation model and added it to the color ramp it became clear that there was a distinct topographic signature for this sinkhole feature.
The color ramp and the contour data allowed us to look for areas with similar topographic signatures in the image. Doing this, we located 16 possible sinkhole locations in the Macal Valley and another 15 in the Roaring Creek Valley.
The data we generated in the field were quite helpful in our evaluation of two advanced remote-sensing platforms for their usefulness for locating cave sites. The resolution of the LANDSAT 5 thermal band was simply too coarse, and therefore was ineffectual. Our classification of the LANDSAT multispectral bands yielded interesting results, yet we are not convinced that they are meaningful or even replicable. The Star 3i RADAR data, on the other hand, showed great promise for locating sinkholes. However, we can't verify this until the sites are visited and documented as actual sinkholes. Reconnaissance missions will provide the necessary ground-truthing information to verify the results.
As new and improved imagery becomes more readily available for scientific research, we are confident that we will be able to efficiently locate Maya cave sites using remote sensing from space. These investigations from the vantage point of the heavens should lead to discoveries that will ultimately shed new light on the Maya and the use of caves in ancient Mesoamerica.
How to cite this page:
Griffith, Cameron. "Locating Cave Sites: Results of our Remote-sensing
Research." Archaeology.
Archaeological Institute of America. 20 Sep.
2001. Web. (Date of
access).
http://interactive.archaeology.org/belize/newremote.html.

)
)

